20 Netstat Commands for Linux Network Management

The Management server, DNS server, host name, and default gateway network interfaces are configured. To add the hostname/IP address automatically to the Management server, use the net set autohost command. It is also possible to set how long it takes before a lost carrier is reported. If you want to check whether your different settings are correct, you can run net show memory after executing multiple net set commands. Following the confirmation, you can restart your computer to take effect.
Configure all items to static values or none to improve startup time in networks without DHCP servers. Use either Dynamic or Static addressing for all your settings (IP address, hostname, domain, etc.) instead of a mix.
The Management server may take a while to start when any value is configured to be obtained through DHCP. In this article, we will learn the 20 netstat commands for Network management in Linux.
What is Netstat Command?

Netstat (network statistics) is a command-line tool that can be used to view information about incoming and outgoing network connections, routing tables, interface statistics, etc.
In addition to operating systems based on Unix-like environments, netstat is also available on Windows. Performance measurements and network troubleshooting are very useful with it.
You can use netstat to check which ports are open and if any programs are listening on them. It is one of the most basic tools for debugging network services.
The netstat command in Linux has been replaced by the new ss command, which displays much more information about network connections and is faster than the older netstat command.
For Linux system administrators and network administrators, the netstat tool is of great importance and great use in monitoring and troubleshooting network problems and determining network traffic performance.
With examples, this article shows how the netstat command can be used in a day-to-day operation.
List of Netstat Commands with examples

1. An overview of all TCP and UDP connections LISTENING
Listing all TCP and UDP ports using the netstat -a option.
# netstat -a | more
A working Internet connection (servers and established)
Proto Recv-Q Send-Q Local Address netstat foreign address
State
tcp 0 0 *:sunrpc *:* LISTEN
tcp 0 52 192.168.0.2:ssh 192.168.0.1:egs ESTABLISHED
tcp 1 0 192.168.0.2:59292 www.gov.com:http CLOSE_WAIT
tcp 0 0 localhost:smtp *:* LISTEN
tcp 0 0 *:59482 *:* LISTEN
udp 0 0 *:35036 *:*
udp 0 0 *:npmp-local *:*
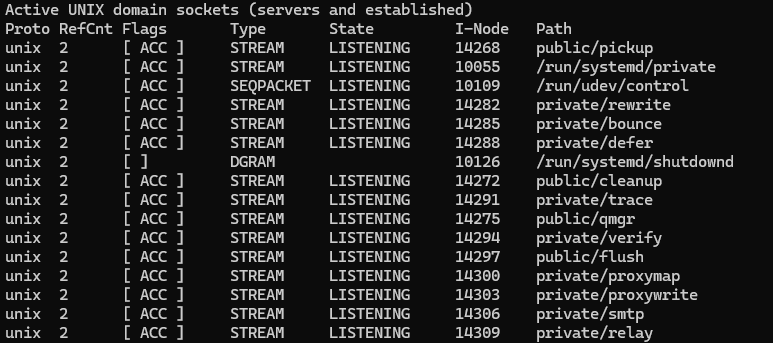
(Servers and established) UNIX domain sockets
Proto RefCnt Flags Type State I-Node Path
unix 2 [ ACC ] STREAM LISTENING 16972 /tmp/orbit-root/linc-76b-0-6fa08790553d6
unix 2 [ ACC ] STREAM LISTENING 17149 /tmp/orbit-root/linc-794-0-7058d584166d2
unix 2 [ ACC ] STREAM LISTENING 17161 /tmp/orbit-root/linc-792-0-546fe905321cc
unix 2 [ ACC ] STREAM LISTENING 15938 /tmp/orbit-root/linc-74b-0-415135cb6aeab
2. Listing TCP Ports connections
netstat usage -at to show only TCP (Transmission Control Protocol) port connections.
# netstat -at
Active Internet connections (servers and established)
Proto Recv-Q Send-Q Local Address netstat foreign address
State
tcp 0 0 *:ssh *:* LISTEN
tcp 0 0 localhost:ipp *:* LISTEN
tcp 0 0 localhost:smtp *:* LISTEN
tcp 0 52 192.168.0.2:ssh 192.168.0.1:egs ESTABLISHED
tcp 1 0 192.168.0.2:59292 www.gov.com:http CLOSE_WAIT
3. Listing UDP Ports connections
netstat usage -au, this command lists only UDP (User Datagram Protocol ) port connections.
# netstat -au
Active Internet connections (servers and established)
Proto Recv-Q Send-Q Local Address netstat foreign address
State
udp 0 0 *:35036 *:*
udp 0 0 *:npmp-local *:*
udp 0 0 *:mdns *:*
4. Listing all LISTENING Connections
Netstat -l displays all active listening port connections.
# netstat -l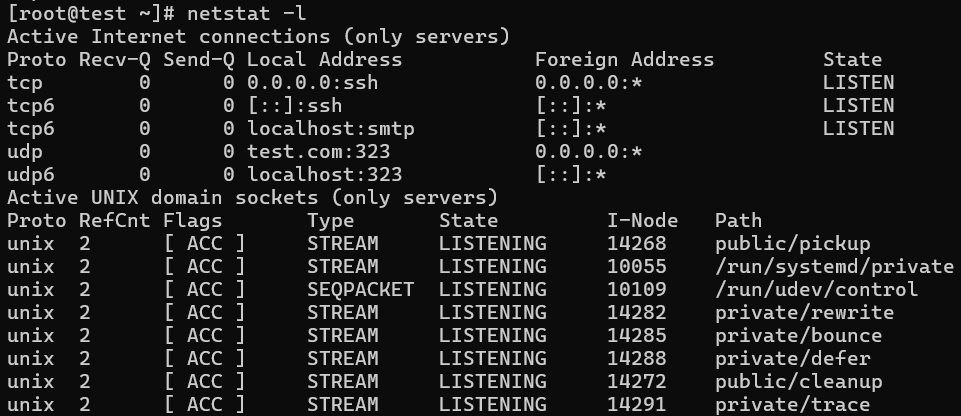
Active Internet connections (only servers)
Proto Recv-Q Send-Q Local Address Foreign Address State
tcp 0 0 *:sunrpc *:* LISTEN
tcp 0 0 *:58642 *:* LISTEN
tcp 0 0 *:ssh *:* LISTEN
udp 0 0 *:35036 *:*
udp 0 0 *:npmp-local *:*
Active UNIX domain sockets (only servers)
Proto RefCnt Flags Type State I-Node Path
unix 2 [ ACC ] STREAM LISTENING 16972 /tmp/orbit-root/linc-76b-0-6fa08790553d6
unix 2 [ ACC ] STREAM LISTENING 17149 /tmp/orbit-root/linc-794-0-7058d584166d2
unix 2 [ ACC ] STREAM LISTENING 17161 /tmp/orbit-root/linc-792-0-546fe905321cc
unix 2 [ ACC ] STREAM LISTENING 15938 /tmp/orbit-root/linc-74b-0-415135cb6aeab
5. Listing all TCP Listening Ports
Use the option netstat -lt to list all active TCP ports.
# netstat -lt
Active Internet connections (only servers)
Proto Recv-Q Send-Q Local Address Foreign Address State
tcp 0 0 *:dctp *:* LISTEN
tcp 0 0 *:mysql *:* LISTEN
tcp 0 0 *:sunrpc *:* LISTEN
tcp 0 0 *:munin *:* LISTEN
tcp 0 0 *:ftp *:* LISTEN
tcp 0 0 localhost.localdomain:ipp *:* LISTEN
tcp 0 0 localhost.localdomain:smtp *:* LISTEN
tcp 0 0 *:http *:* LISTEN
tcp 0 0 *:ssh *:* LISTEN
tcp 0 0 *:https *:* LISTEN
6. Listing all UDP Listening Ports
The option netstat -lu lists all UDP ports that are actively listening.
# netstat -lu
Active Internet connections (only servers)
Proto Recv-Q Send-Q Local Address Foreign Address State
udp 0 0 *:39578 *:*
udp 0 0 *:meregister *:*
udp 0 0 *:vpps-qua *:*
udp 0 0 *:openvpn *:*
udp 0 0 *:mdns *:*
udp 0 0 *:sunrpc *:*
udp 0 0 *:ipp *:*
udp 0 0 *:60222 *:*
udp 0 0 *:mdns *:*
7. Listing all UNIX Listening Ports
Listing all active UNIX listening ports using netstat -lx.
# netstat -lx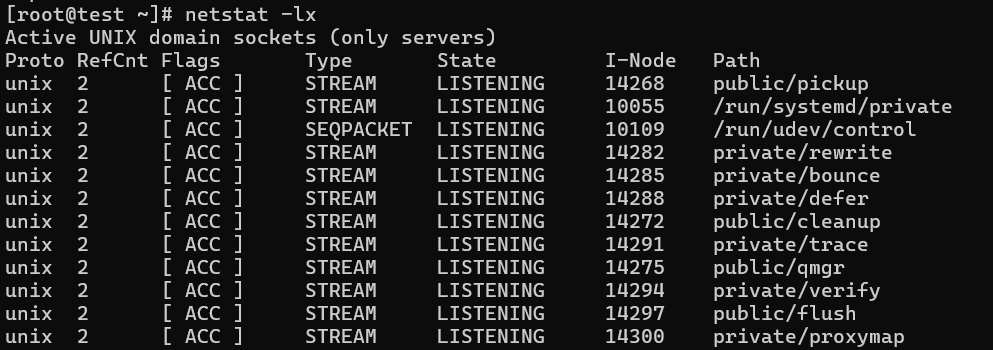
Active UNIX domain sockets (only servers)
Proto RefCnt Flags Type State I-Node Path
unix 2 [ ACC ] STREAM LISTENING 4171 @ISCSIADM_ABSTRACT_NAMESPACE
unix 2 [ ACC ] STREAM LISTENING 5767 /var/run/cups/cups.sock
unix 2 [ ACC ] STREAM LISTENING 7082 @/tmp/fam-root-
unix 2 [ ACC ] STREAM LISTENING 6157 /dev/gpmctl
unix 2 [ ACC ] STREAM LISTENING 6215 @/var/run/hald/dbus-IcefTIUkHm
unix 2 [ ACC ] STREAM LISTENING 6038 /tmp/.font-unix/fs7100
unix 2 [ ACC ] STREAM LISTENING 6175 /var/run/avahi-daemon/socket
unix 2 [ ACC ] STREAM LISTENING 4157 @ISCSID_UIP_ABSTRACT_NAMESPACE
unix 2 [ ACC ] STREAM LISTENING 60835836 /var/lib/mysql/mysql.sock
unix 2 [ ACC ] STREAM LISTENING 4645 /var/run/audispd_events
unix 2 [ ACC ] STREAM LISTENING 5136 /var/run/dbus/system_bus_socket
unix 2 [ ACC ] STREAM LISTENING 6216 @/var/run/hald/dbus-wsUBI30V2I
unix 2 [ ACC ] STREAM LISTENING 5517 /var/run/acpid.socket
unix 2 [ ACC ] STREAM LISTENING 5531 /var/run/pcscd.comm
8. Showing Statistics by Protocol
Displays statistics by protocol. By default, statistics are shown for the TCP, UDP, ICMP, and IP protocols. The -s parameter can be used to specify a set of protocols.
# netstat -s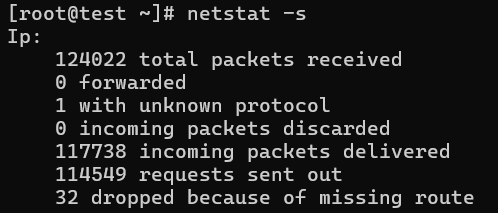
Ip:
2461 total packets received
0 forwarded
0 incoming packets discarded
2431 incoming packets delivered
2049 requests sent out
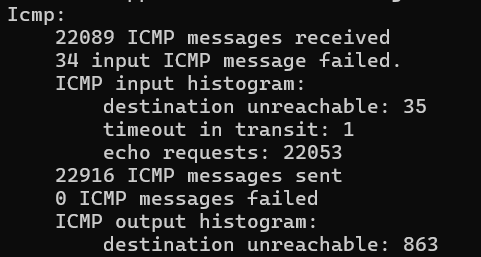
Icmp:
0 ICMP messages received
0 input ICMP message failed.
ICMP input histogram:
1 ICMP messages sent
0 ICMP messages failed
ICMP output histogram:
destination unreachable: 1
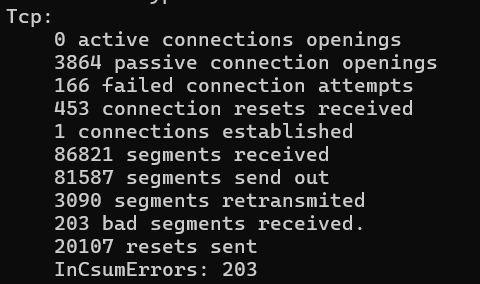
Tcp:
159 active connections openings
1 passive connection openings
4 failed connection attempts
0 connection resets received
1 connections established
2191 segments received
1745 segments send out
24 segments retransmited
0 bad segments received.
4 resets sent

Udp:
243 packets received
1 packets to unknown port received.
0 packet receive errors
281 packets sent
9. Showing Statistics by TCP Protocol
Showing statistics of only TCP protocol by using option netstat -st.
# netstat -st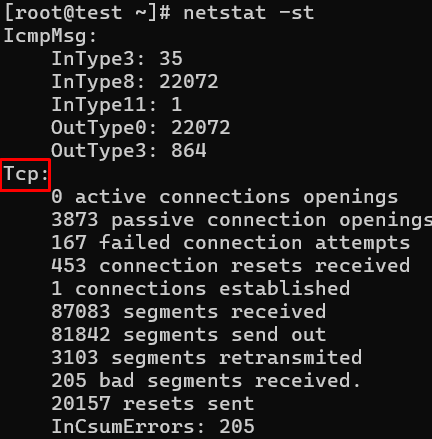
Tcp:
2805201 active connections openings
1597466 passive connection openings
1522484 failed connection attempts
37806 connection resets received
1 connections established
57718706 segments received
64280042 segments send out
3135688 segments retransmited
74 bad segments received.
17580 resets sent
10. Showing Statistics by UDP Protocol
# netstat -su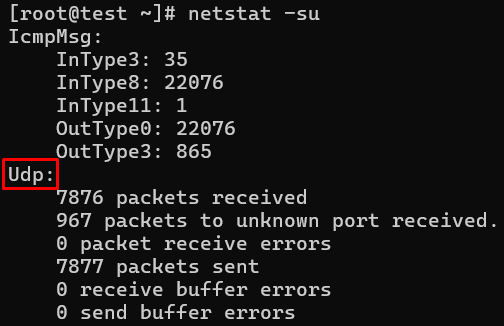
Udp:
1774823 packets received
901848 packets to unknown port received.
0 packet receive errors
2968722 packets sent
11. Displaying Service name with PID
Displaying service name with their PID number, using option netstat -tp will display “PID/Program Name“.
# netstat -tp
Active Internet connections (w/o servers)
Proto Recv-Q Send-Q Local Address Foreign Address State PID/Program name
tcp 0 0 192.168.0.2:ssh 192.168.0.1:egs ESTABLISHED 2179/sshd
tcp 1 0 192.168.0.2:59292 www.gov.com:http CLOSE_WAIT 1939/clock-applet
12. Displaying Promiscuous Mode
When using the -ac switch, you can display promiscuous mode or refresh the screen every five seconds. It is set to refresh every second by default.
# netstat -ac 5 | grep tcp
tcp 0 0 *:sunrpc *:* LISTEN
tcp 0 0 *:58642 *:* LISTEN
tcp 0 0 *:ssh *:* LISTEN
tcp 0 0 localhost:ipp *:* LISTEN
tcp 0 0 localhost:smtp *:* LISTEN
tcp 1 0 192.168.0.2:59447 www.gov.com:http CLOSE_WAIT
tcp 0 52 192.168.0.2:ssh 192.168.0.1:egs ESTABLISHED
tcp 0 0 *:sunrpc *:* LISTEN
tcp 0 0 *:ssh *:* LISTEN
tcp 0 0 localhost:ipp *:* LISTEN
tcp 0 0 localhost:smtp *:* LISTEN
tcp 0 0 *:59482 *:* LISTEN
13. Displaying Kernel IP routing
With the netstat and route commands, you can display the kernel IP routing table.
# netstat -r
Kernel IP routing table
Destination Gateway Genmask Flags MSS Window irtt Iface
192.168.0.0 * 255.255.255.0 U 0 0 0 eth0
link-local * 255.255.0.0 U 0 0 0 eth0
default 192.168.0.1 0.0.0.0 UG 0 0 0 eth0
14. Showing Network Interface Transactions
Displays both the transferring and receiving packet transactions for the network interface.
# netstat -i
rdp
Kernel Interface table
Iface MTU Met RX-OK RX-ERR RX-DRP RX-OVR TX-OK TX-ERR TX-DRP TX-OVR Flg
eth0 1500 0 4459 0 0 0 4057 0 0 0 BMRU
lo 16436 0 8 0 0 0 8 0 0 0 LRU
15. Showing Kernel Interface Table
Like ifconfig, this command displays the kernel interface table.
# netstat -ie
Kernel Interface table
eth0 Link encap:Ethernet HWaddr 00:0C:29:B4:DA:21
inet addr:192.168.0.2 Bcast:192.168.0.255 Mask:255.255.255.0
inet6 addr: fe80::20c:29ff:feb4:da21/64 Scope:Link
UP BROADCAST RUNNING MULTICAST MTU:1500 Metric:1
RX packets:4486 errors:0 dropped:0 overruns:0 frame:0
TX packets:4077 errors:0 dropped:0 overruns:0 carrier:0
collisions:0 txqueuelen:1000
RX bytes:2720253 (2.5 MiB) TX bytes:1161745 (1.1 MiB)
Interrupt:18 Base address:0x2000

lo Link encap:Local Loopback
inet addr:127.0.0.1 Mask:255.0.0.0
inet6 addr: ::1/128 Scope:Host
UP LOOPBACK RUNNING MTU:16436 Metric:1
RX packets:8 errors:0 dropped:0 overruns:0 frame:0
TX packets:8 errors:0 dropped:0 overruns:0 carrier:0
collisions:0 txqueuelen:0
RX bytes:480 (480.0 b) TX bytes:480 (480.0 b)
16. Displaying IPv4 and IPv6 Information
Information about multicast group membership is displayed for both IPv4 and IPv6.
# netstat -g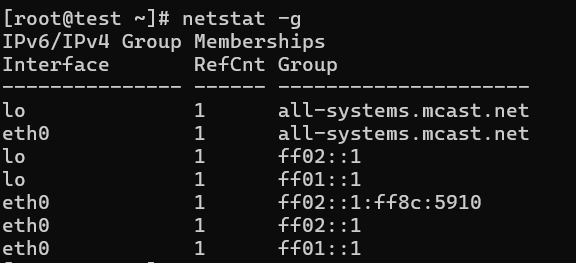
IPv6/IPv4 Group Memberships
Interface RefCnt Group
————— —— ———————
lo 1 all-systems.mcast.net
eth0 1 224.0.0.251
eth0 1 all-systems.mcast.net
lo 1 ff02::1
eth0 1 ff02::202
eth0 1 ff02::1:ffb4:da21
eth0 1 ff02::1
17. Print Netstat Information Continuously
Using the following command will print network statistics every few seconds, so you can get it continuously.
# netstat -c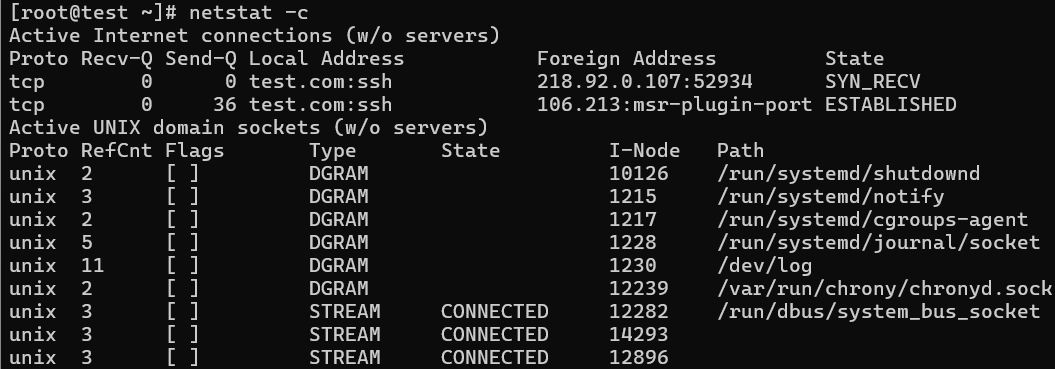
Active Internet connections (w/o servers)
Proto Recv-Q Send-Q Local Address Foreign Address State
tcp 0 0 tecmint.com:http sg2nlhg007.shr.prod.s:36944 TIME_WAIT
tcp 0 0 tecmint.com:http sg2nlhg010.shr.prod.s:42110 TIME_WAIT
tcp 0 132 tecmint.com:ssh 115.113.134.3.static-:64662 ESTABLISHED
tcp 0 0 tecmint.com:http crawl-66-249-71-240.g:41166 TIME_WAIT
tcp 0 0 localhost.localdomain:54823 localhost.localdomain:smtp TIME_WAIT
tcp 0 0 localhost.localdomain:54822 localhost.localdomain:smtp TIME_WAIT
tcp 0 0 tecmint.com:http sg2nlhg010.shr.prod.s:42091 TIME_WAIT
tcp 0 0 tecmint.com:http sg2nlhg007.shr.prod.s:36998 TIME_WAIT
18. Finding non-supportive Address
Finding un-configured address families with some useful information.
# netstat --verbose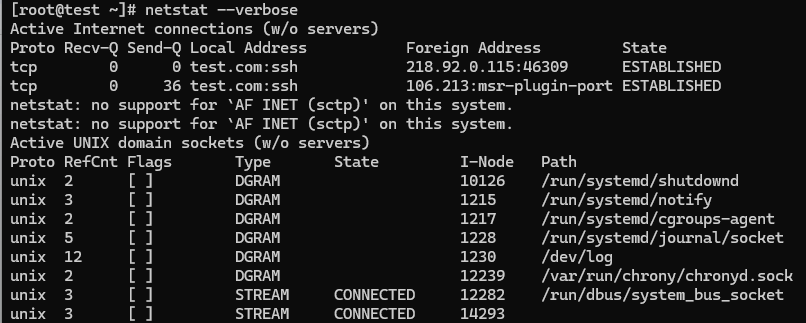
netstat: no support for `AF IPX’ on this system.
netstat: no support for `AF AX25′ on this system.
netstat: no support for `AF X25′ on this system.
netstat: no support for `AF NETROM’ on this system.
19. Finding Listening Programs
You can find out how many programs are listening on a port.
# netstat -ap | grep http
tcp 0 0 *:http *:* LISTEN 9056/httpd
tcp 0 0 *:https *:* LISTEN 9056/httpd
tcp 0 0 tecmint.com:http sg2nlhg008.shr.prod.s:35248 TIME_WAIT –
tcp 0 0 tecmint.com:http sg2nlhg007.shr.prod.s:57783 TIME_WAIT –
tcp 0 0 tecmint.com:http sg2nlhg007.shr.prod.s:57769 TIME_WAIT –
tcp 0 0 tecmint.com:http sg2nlhg008.shr.prod.s:35270 TIME_WAIT –
tcp 0 0 tecmint.com:http sg2nlhg009.shr.prod.s:41637 TIME_WAIT –
tcp 0 0 tecmint.com:http sg2nlhg009.shr.prod.s:41614 TIME_WAIT –
unix 2 [ ] STREAM CONNECTED 88586726 10394/httpd
20. Displaying RAW Network Statistics
# netstat --statistics --raw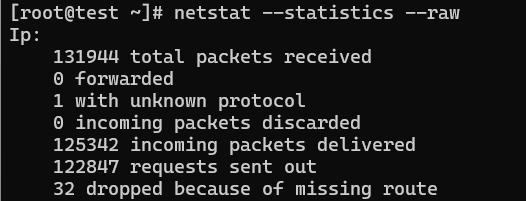
Ip:
62175683 total packets received
52970 with invalid addresses
0 forwarded
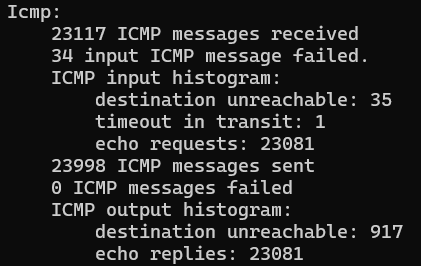
Icmp:
875519 ICMP messages received
destination unreachable: 901671
echo request: 8
echo replies: 16253
IcmpMsg:
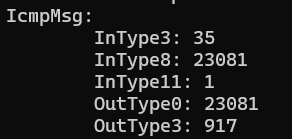
InType0: 83
IpExt:
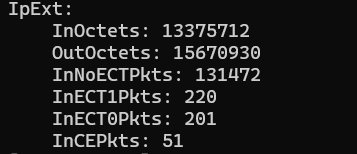
InMcastPkts: 117
You can further explore the netstat command by consulting the netstat manual docs or using the man netstat command to learn more.
Also Read: How to Set Environment Variables in Linux?
Please let us know of any missing items in the list by contacting ServerWala. Based on your queries, we can continue to update this list.


