List Process Linux – How to Check Running Processes?

Introduction
Apprehending the processes running on your Linux system is vital for effective system administration. It does not matter if you are a system administrator or a keen user, this guide will walk you through various methods to list and identify running processes on your Linux machine. Let us discuss the details of every process and explore how they can render helpful insights into your system’s activity.
List Processes in Linux
In the world of Linux, several commands allow you to obtain a list of running processes. Each command comes with its unique features, providing different perspectives on your system’s performance. Here, we’ll explore the commonly used commands: ps, top, htop, and atop.
List Running Processes in Linux by Using the ps Command
The ps command, short for “process status,” is a flexible and fundamental tool for inspecting running processes on a Linux system. It provides valuable insights into the current state of your system, offering a detailed list of processes, including information about resource usage, ownership, and execution status.
To utilize the ps command, open your terminal and type the given below command:
ps aux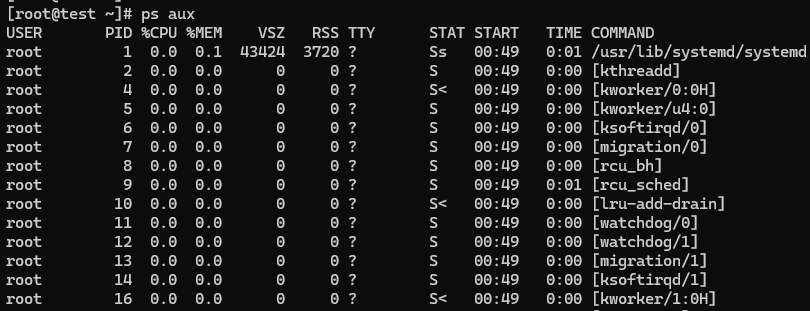
The ps aux command provides a comprehensive overview of all processes running on the system.
ps: The primary command for querying information about processes.

a: Displays information about all users. It ensures that processes from all users are included in the output.
u: Displays additional information, including the username and other details such as the start time of the process.
x: Lists processes without a controlling terminal, ensuring that processes not associated with a terminal are also included in the output.
This command produces a detailed list that includes the Process ID (PID), the percentage of CPU and memory utilization, the user who initiated the process, the start time, and the command that triggered the process.
One of the strengths of the ps command lies in its flexibility. You can customize the output by combining different options. For example, to view a hierarchical tree structure of processes, you can use:
ps auxf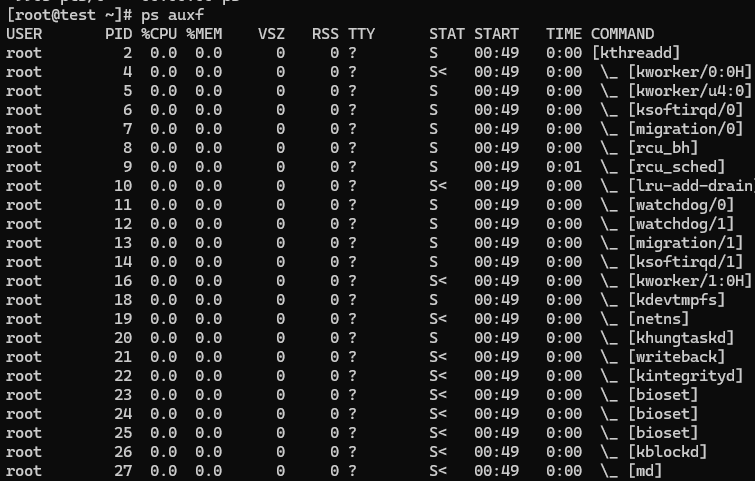
This command presents a visual representation of the process hierarchy, making understanding the parent-child relationships among different processes easier.
Moreover, you can filter the output to emphasize on particular users or procedures. For instance, to display processes initiated by a specific user (replace “username” with the actual username):
ps -u username
The ps command provides a robust foundation for process examination, and its adaptability makes it an invaluable tool for both beginners and experienced users. By exploring and combining various options, you can tailor the output to meet your specific requirements, gaining a deeper understanding of the system’s behavior and resource utilization.
List Running Processes in Linux by Using the top Command
When it comes to real-time monitoring of running processes on a Linux system, the top command stands out as a go-to option for users seeking instantaneous insights into system activity. By executing the following simple command:
Top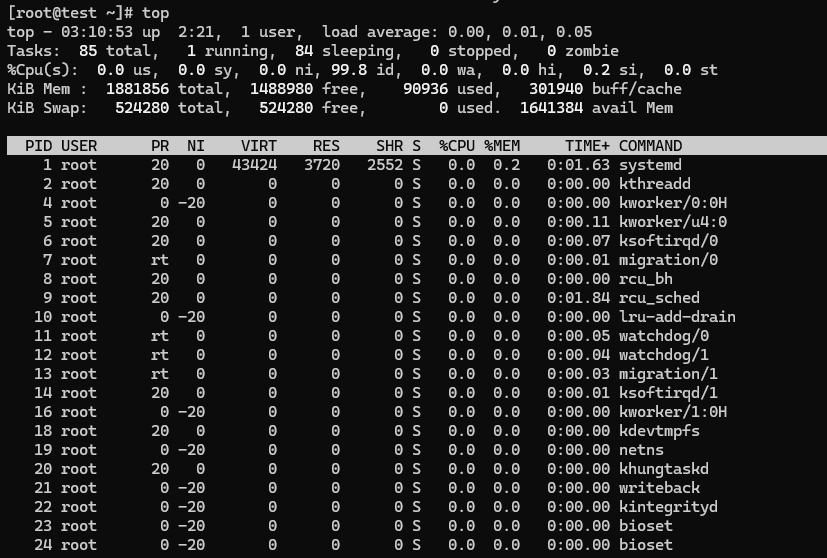
Users can access an interactive and dynamically updating list of processes, offering a real-time snapshot of the system’s performance. The top command is especially useful for identifying processes that are currently consuming the most system resources, such as CPU and memory.
The interactive nature of the top command makes it a powerful tool for on-the-fly analysis. As the command runs, it continuously refreshes the displayed information, allowing users to monitor changes in real-time.
Navigating through the top interface is straightforward. Employ the arrow keys to scroll via the processes’ list, and observe essential information such as the process ID (PID), user, %CPU, %MEM, and more. Additionally, color-coded highlights make it easy to identify critical aspects of system resource utilization.
To exit the top command and come back to the terminal, press the ‘q’ key. This quick exit mechanism ensures that users can seamlessly transition between monitoring processes and performing other tasks in the terminal.
While the default top view provides valuable information, users can customize the display to suit their specific needs. For instance, pressing the ‘z’ key toggles between displaying or hiding individual threads associated with processes. The ‘f’ key allows users to choose and order the displayed columns, tailoring the output to their preferences.
List Running Processes in Linux by Using the htop Command
When it comes to monitoring and managing running processes on a Linux system, the htop command emerges as a user-friendly and feature-rich alternative to the traditional top command. If you haven’t installed htop yet, consider doing so by following these commands:
For Debian-based systems (e.g., Ubuntu):
sudo apt-get install htopFor Red Hat-based systems (e.g., CentOS):
sudo yum install htop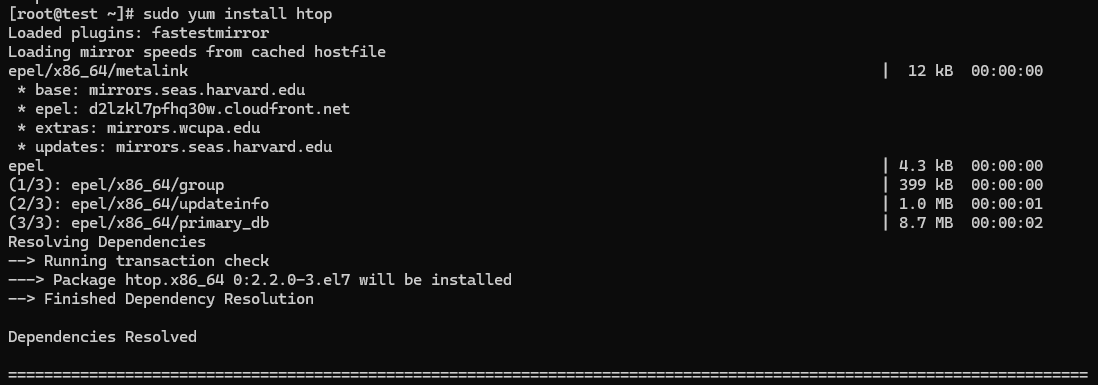
After the installation is complete, simply run:
htop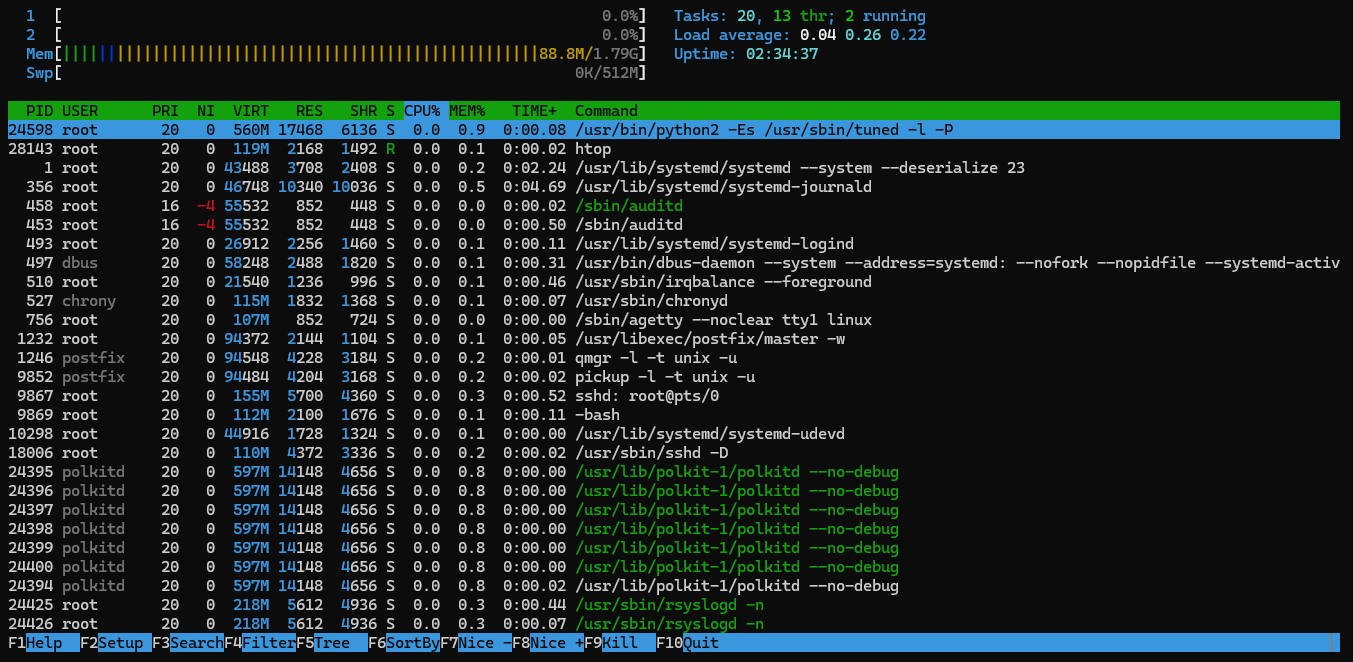
htop introduces a more visually appealing and interactive interface, enhancing the user experience compared to top. Its color-coded display makes it easier to interpret information quickly, providing a clearer representation of system metrics.
Navigating through the list of processes in htop is intuitive. Employ the arrow keys to scroll via the processes’ list and explore various details about each process. The color-coded display distinguishes between different types of resource usage, such as CPU, memory, and swap usage, allowing users to identify performance bottlenecks effortlessly.
Function keys in htop provide additional options for refining your view and interacting with processes. For example:

F2 (Setup): Customize the display settings, allowing you to choose which columns to show and hide.
F3 (Search): Filter processes based on criteria, simplifying the identification of specific applications or users.
F4 (Filter): Quickly filter the displayed processes by a specific value, aiding in targeted analysis.
F9 (Kill): Send a signal to terminate a selected process.
In addition to these features, htop offers a tree view, presenting a hierarchical structure of processes and their relationships. This attribute is specifically effective for apprehending the parent-child associations among different processes.
htop is designed to be both powerful and user-friendly, making it an excellent choice for users at various skill levels. Whether you’re a system administrator seeking a comprehensive overview or a casual user curious about resource usage, htop provides an accessible and informative way to monitor running processes on your Linux system.
List Running Processes in Linux by Using the atop Command
For those seeking a comprehensive view that extends beyond real-time monitoring, the atop command stands as a powerful choice. It not only offers a live process list but also provides a historical perspective on system performance. To get started with atop, follow these installation and execution steps:
For Debian-based systems (e.g., Ubuntu):
sudo apt-get install atopFor Red Hat-based systems (e.g., CentOS):
sudo yum install atop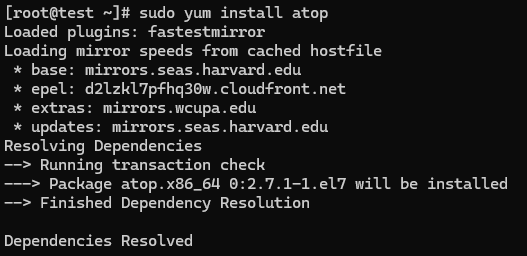

Once installed, initiate the atop command:
Atop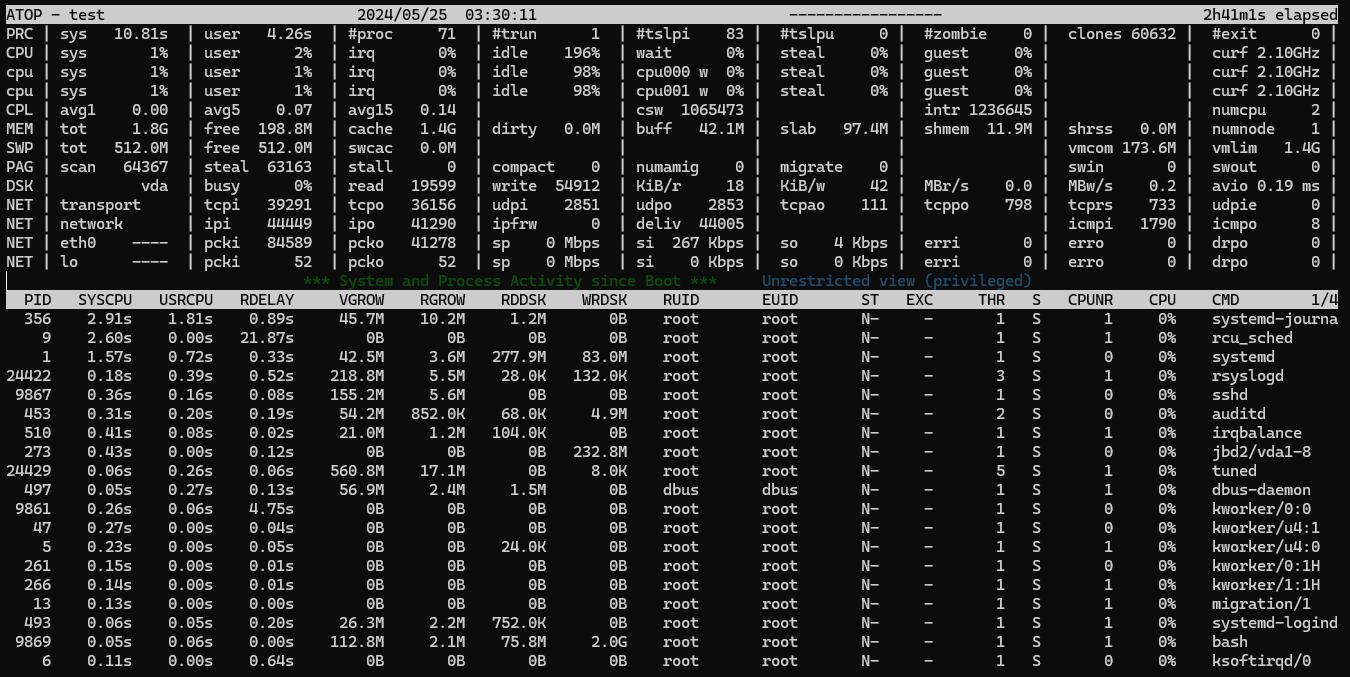
The atop command presents users with a unique and insightful combination of real-time and historical data. This makes it an invaluable tool for those interested in understanding not only the current state of their system but also its performance trends over time.
To navigate through time and access historical data, use the ‘t’ key. This action opens a time-driven interactive menu, allowing you to select a specific timeframe for analysis. By examining historical records, users can identify patterns, spikes, or anomalies in system resource usage, aiding in the detection of performance issues or irregularities.
For a closer look at individual processes, press ‘p’ to access detailed information. This view includes crucial metrics such as CPU and memory usage, disk activity, and network utilization. The process list also displays process IDs (PIDs) and resource consumption over time, facilitating a thorough analysis of each application’s behavior.
One notable feature of atop is its ability to highlight resource bottlenecks, making it easier for users to pinpoint performance-critical areas. Whether it’s CPU saturation, memory constraints, or disk I/O limitations, atop offers a clear and intuitive representation, aiding in swift issue identification and resolution.
The comprehensive overview provided by atop extends beyond what traditional process monitoring tools offer. System administrators and power users can leverage this data to make informed decisions about resource allocation, capacity planning, and overall system optimization.
Find Process IDs Using the pgrep Command
In the realm of Linux process management, the pgrep command serves as a specialized tool for efficiently locating and retrieving Process IDs (PIDs) based on the names of processes. This functionality proves invaluable when users want to identify and manipulate specific processes without navigating through extensive lists. The pgrep command is straightforward to use and provides quick results.
To exemplify, let’s consider a scenario where you wish to find the PID of the Firefox browser process. Execute the given below command:
pgrep firefox
Upon executing this command, the terminal promptly returns the PID associated with the Firefox process, simplifying the task of tracking and managing this specific application.
One of the notable advantages of the pgrep command lies in its simplicity. It abstracts the complexity of dealing with extensive process listings and allows users to focus on pinpointing the PID they need. This is particularly beneficial in scripting scenarios or situations where automation is desired, as it provides an efficient means of obtaining the necessary information without parsing or filtering large datasets.
Moreover, the pgrep command offers additional options for refining search criteria. For instance, you can employ the -i flag to perform a case-insensitive search, ensuring that processes with names matching the specified pattern, regardless of case, are captured. This flexibility enhances the versatility of the command and accommodates various user preferences.
pgrep -i firefoxFurthermore, users can leverage pgrep in conjunction with other commands, facilitating seamless integration into more complex workflows. For example, combining pgrep with the kill command enables the termination of processes based on their names or other criteria.
kill -9 $(pgrep firefox)This command, when executed, forcefully terminates all processes matching the name “firefox.” It illustrates how pgrep can be a key component in crafting efficient and targeted process management workflows.
Also Read: How to Use the top Command in Linux?
Conclusion
Mastering the art of listing and understanding running processes in Linux is essential for effective system management. Whether you prefer the simplicity of ps, the real-time updates from top, the user-friendly interface of htop, or the comprehensive insights of atop, these commands empower you to keep your system in check. Additionally, the pgrep command allows for targeted identification of specific processes. Pick the way that best aligns with their necessities and enhances your Linux experience.


